

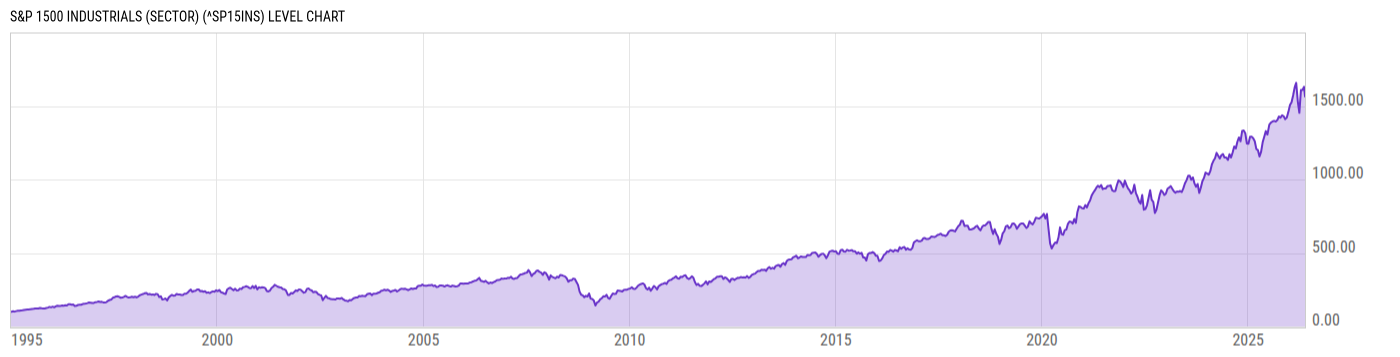
S&P 1500 Industrials (Sector) (^SP15INS)
1592.73
-31.71
(-1.95%)
USD |
May 15, 20:00
Level Chart
Key Stats
Basic Info
| The S&P Composite 1500® Industrials comprises those companies included in the S&P Composite 1500 that are classified as members of the GICS® Industrials sector. The S&P Composite 1500 index includes small cap stocks that may have high growth potential but also meet investability and financial viability criteria. This index uses a float-adjusted market cap weighting. Rebalancing occurs quarterly in March, June, September, and December. | |
| Core Index Name | S&P 1500 Industrials (Sector) |
| Return Type | Price Return |
| Currency Code | USD |
| Category Hedge Type | Not Hedged |
Index Varieties
| Return Types | |
| Total Return | S&P 1500 Industrials (Sector) Total Return |
Total Return Performance
As of May 15, 2026.
Returns for periods of 1 year and above are annualized.
Annual Performance
As of May 16, 2026.
Basic Info
| The S&P Composite 1500® Industrials comprises those companies included in the S&P Composite 1500 that are classified as members of the GICS® Industrials sector. The S&P Composite 1500 index includes small cap stocks that may have high growth potential but also meet investability and financial viability criteria. This index uses a float-adjusted market cap weighting. Rebalancing occurs quarterly in March, June, September, and December. | |
| Core Index Name | S&P 1500 Industrials (Sector) |
| Return Type | Price Return |
| Currency Code | USD |
| Category Hedge Type | Not Hedged |
Index Varieties
| Return Types | |
| Total Return | S&P 1500 Industrials (Sector) Total Return |